Chi Zhang’s GIS Work
Welcome! This is my personal collaboration of GIS work based on the R script.
In the first project, I worked with COVID-19 data in US, monitoring California’s daily new cases, plotting 4 interesting states’ changes of cases, and evaluating the pandemic trending on space and time. Here is the link of workflow.
COVID-19 Data Wrangling
- I was familiar with Rstudio gradually from practices, for instance, analyzing raw data with packages and plotting, combination of raw data, and extracting the variables from raw data.
- In the COVID-19 data wrangling, I started to realize the relationship among data. Data will be influenced by other variables, chronologically and spatially.
- The structure of the code is important too. Well-structured code is easier to debug and present.
Here is my highlight in the project: 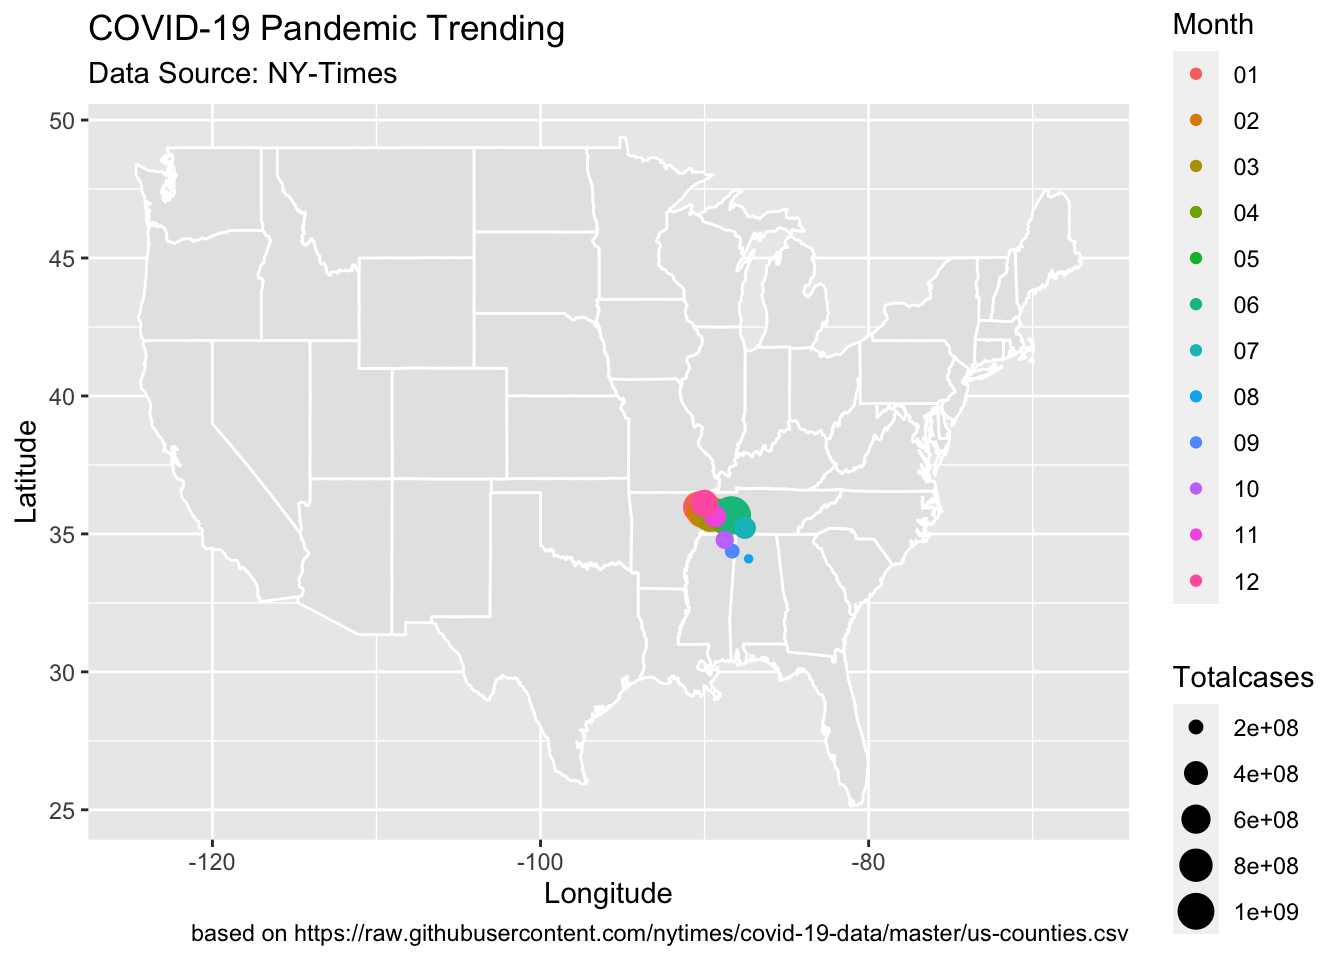 —
—
In the project of US border, I figured out the geographic relationship between US cities and borders of national, states, and near countries. Then I evaluated the 100-mile Border Zone described in ACLU article.
Distance and Projection
- I learned how to build sf objects from R packages and CSVs, using computer to program the projection which studied in the Geog w12.
- In the project, I understand the calculation of distance between geographic objects, such as point, line string and area.
- And I can plot clear map with distance data by ggplot.
Here is my highlight in the project: 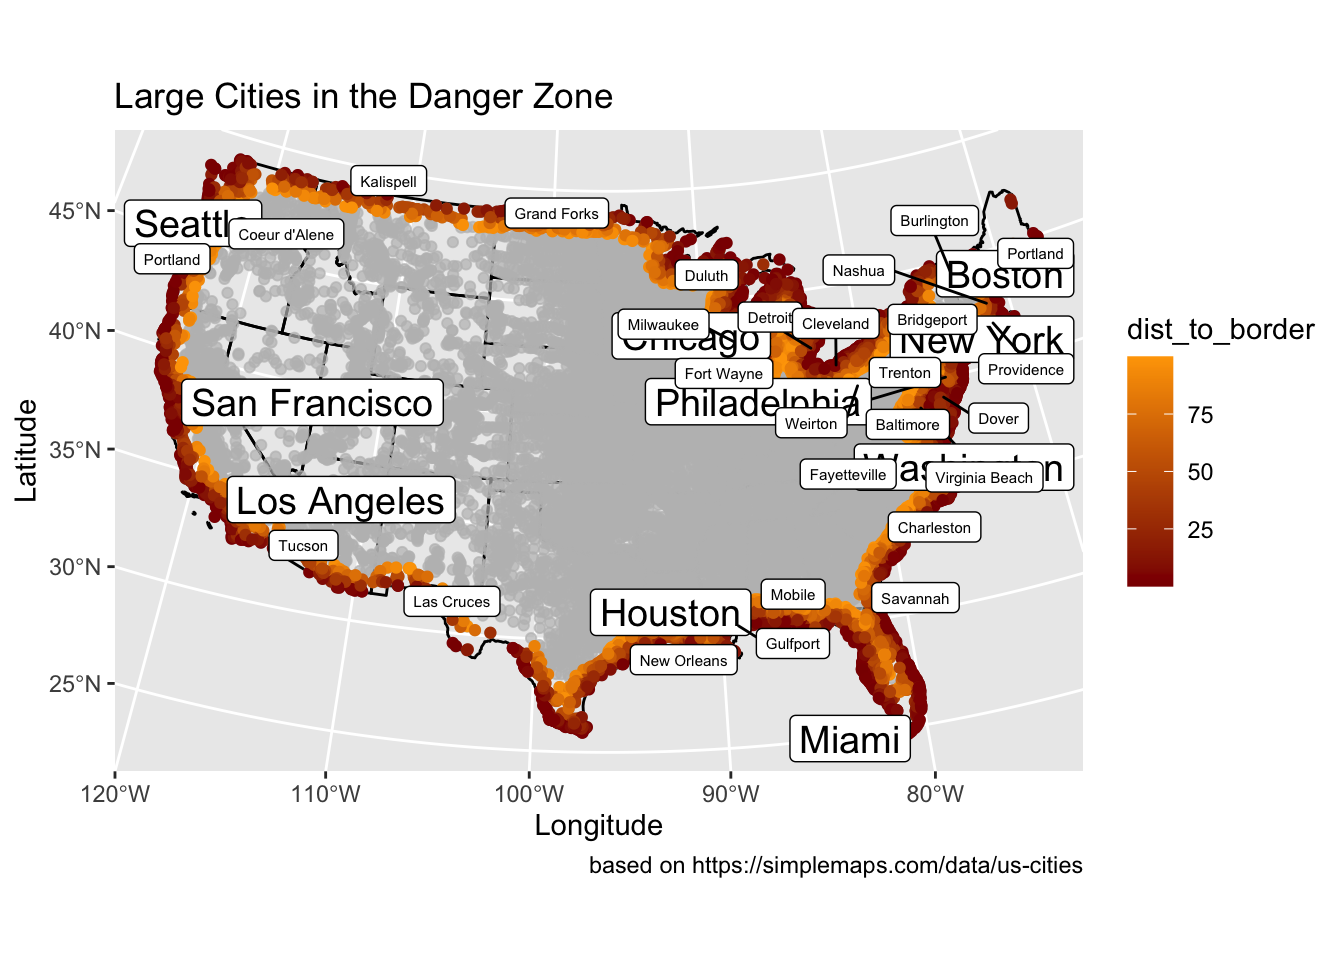 —
—
In the GIS Work of Tessellations, I started to analyze the geographic points in the polygon, with the functions defined by myself. With the raw data of dams in the United States, I tried to find the relationship between the dam distribution and geographic information.
Tessellations, Point-in-Polygon
- Focus: understanding how the tessellation works. Each tessellation has its own advantages and disadvantages, and different attributes.
- Achievements:
- Analysis of the dams’ data in the United States with different tessellation and identifying the difference among them, and define the numbers of dam in each tiles;
- With the distribution of different types, demonstrating the possible reasons of the distribution
- Generation of interactive leaflet map, which shows categorical data of dams in each state within Mississippi River System.
Here is my highlight in the project: 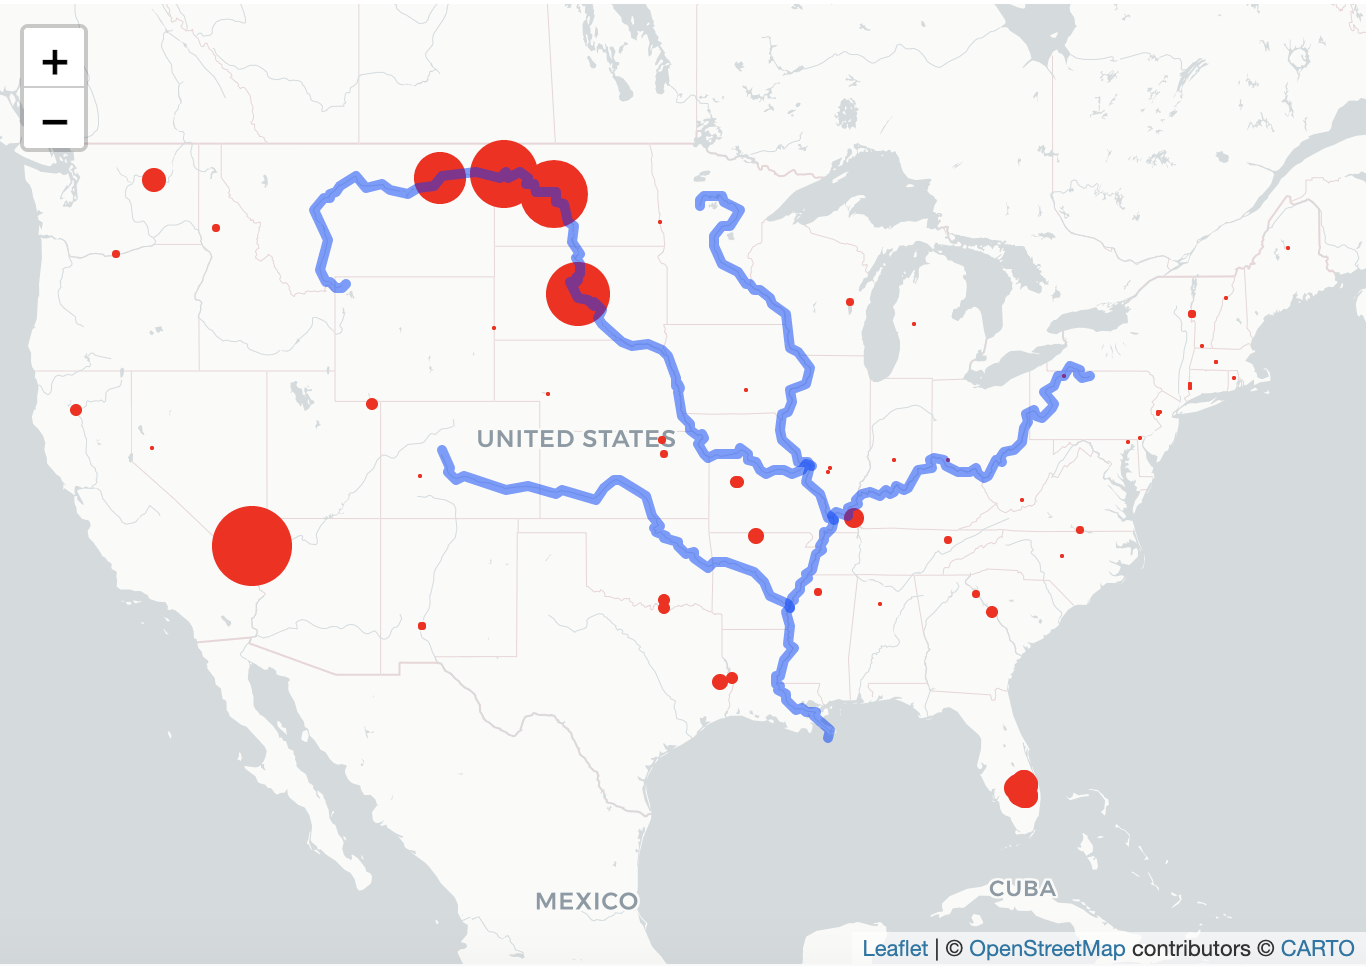 —
—
In the analysis of flooding, we learned to use raster layers to analyze the continuous data, a case of flooding in Palo, Iowa. We used the raster pacakge and raster data knowledge to create flood images using multiband Landsat Imagery, thresholding and classification methods.
Raster and Remote Sensing
- First time I deal with the continuous data with raster data model, and map algebra to analyze elevation, precipitation, and climate.
- In the case of Palo, I use kmean-rasters compared with Landsat band calculating the flooding cells shared by each layers.
- And I extracted a specific location captured by the drone from layers to define its value in the raster data.
Here is my highlight in the project: 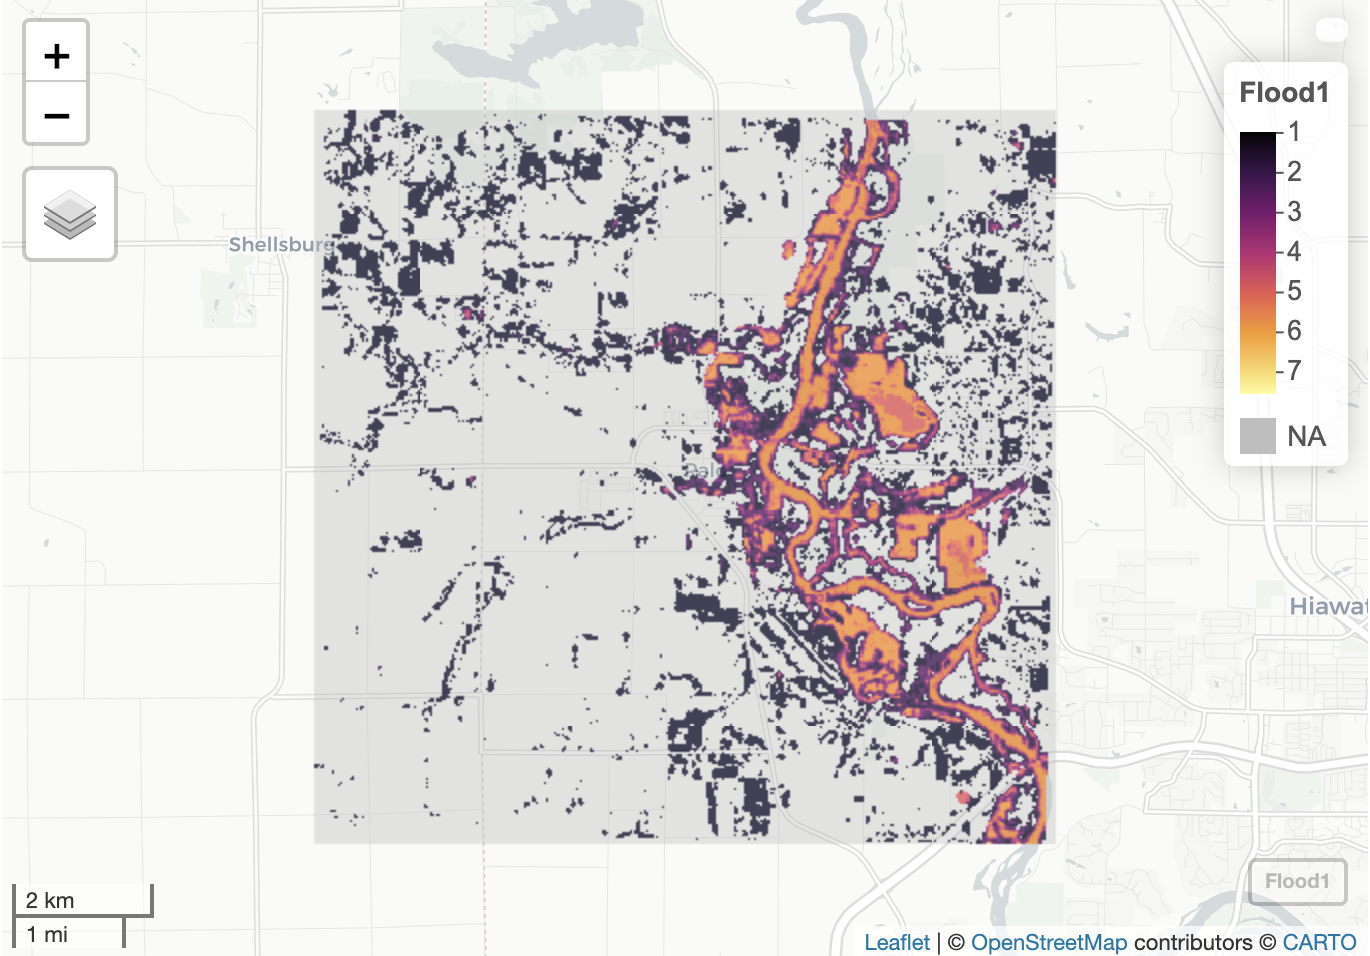
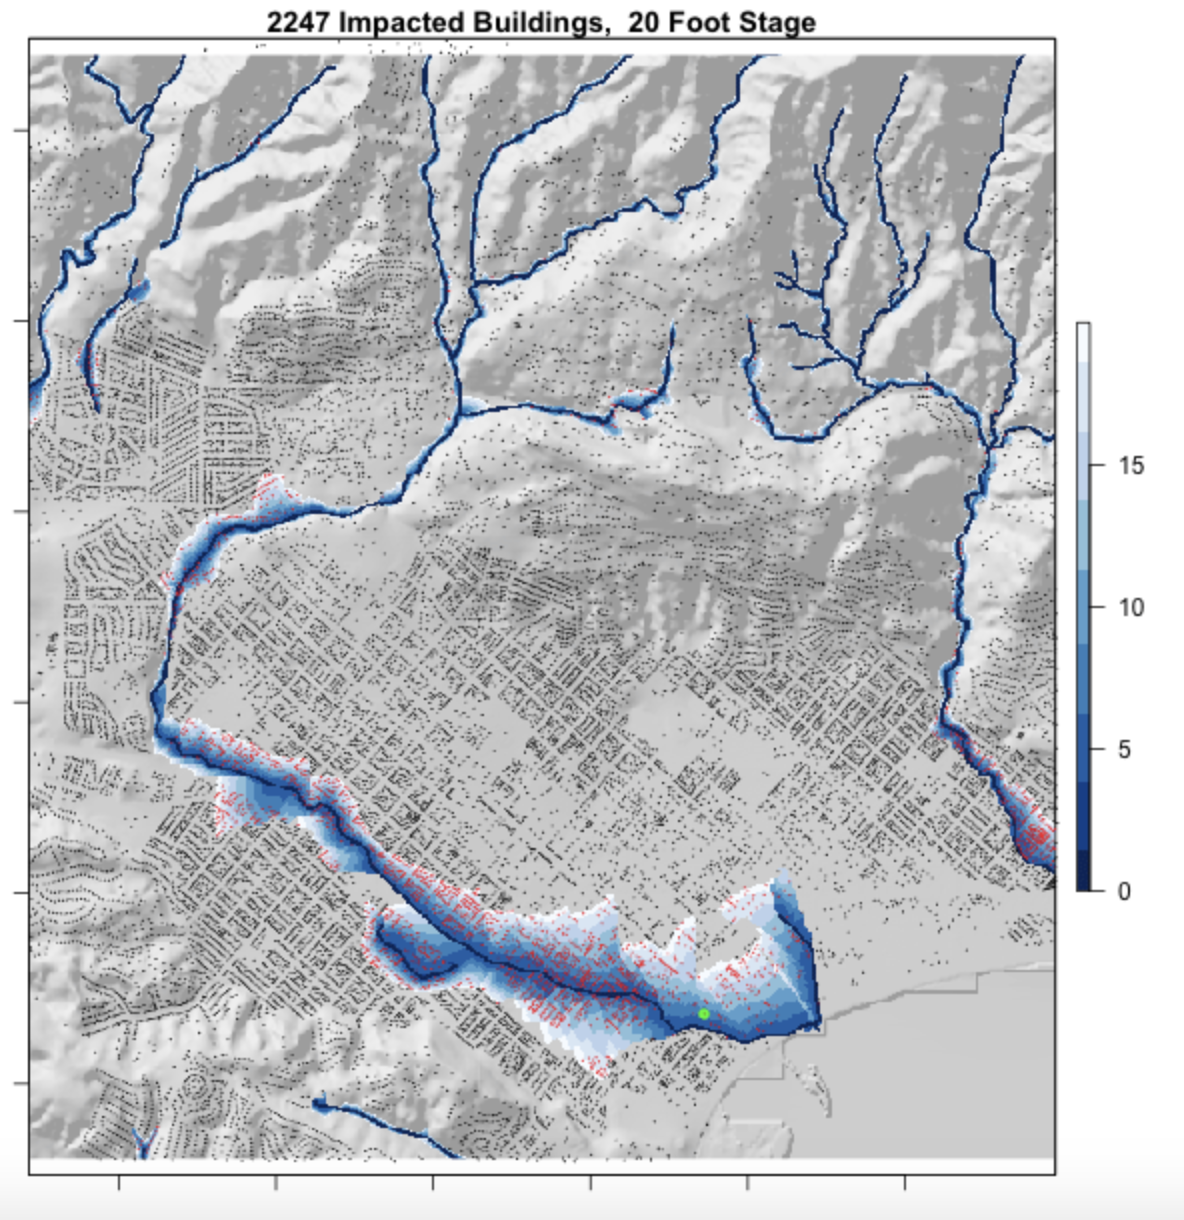
In the GIS Work of raster analysis, terrain analysis is managed by R coding. Mission Creek’s flood event in 2017 in Santa Barbara, California has been chosen as object, estimating the number of buildings impacted. In the project, I completed the whole analysis from collecting data to the assessment of impacts.
Flood Risk in Mission Creek: Past, Present, Future
- Focus: use OSM data to collect building centroids and the stream linestring, and process spatial analysis of flooding in the study area.
- Achievements:
- with the whitebox, create hillshade raster of Santa Barbara area and HAND raster for flooding cell values.
- The correcting of elevation is important in the data, which will impact the precision of analysis.
- In the final step, overlay all raster layers into one, indicating the impacted buildings when the creek flooded.
- create a gif for Mission Creek’s flood inundation map library from 0 to 20 foot.
Here is my highlight in the project: 